
This is a historical market brief based on reporting published November 18, 2026, not a current price update.
Why did the $62,000 area matter? After several weeks of declines, Bitcoin briefly fell to about $61,000 on November 15, a four-month low, then rebounded as high as roughly $66,000. The original report described the buying behind that rebound as uncertain.
Several measures put holder activity near that price range. Glassnode identified the $62,000–$66,000 area, near an August low, as a dense short-term-holder cost-basis zone accounting for about one-fifth of those holders’ coins. It estimated that buyers took up roughly 66,000 BTC there during the two heaviest days of selling. CryptoQuant reported substantial selling by long-term holders between $62,000 and $65,000, with newer buyers taking the other side.
The pressure was not limited to holders. The report put net outflows from U.S. spot Bitcoin ETFs at $2.6 billion over the preceding 10 trading days, including $240 million on November 17. It also said stablecoin supply had fallen 4.2% over 90 days. Those figures describe a difficult funding backdrop; they do not establish that any one flow caused the price decline.
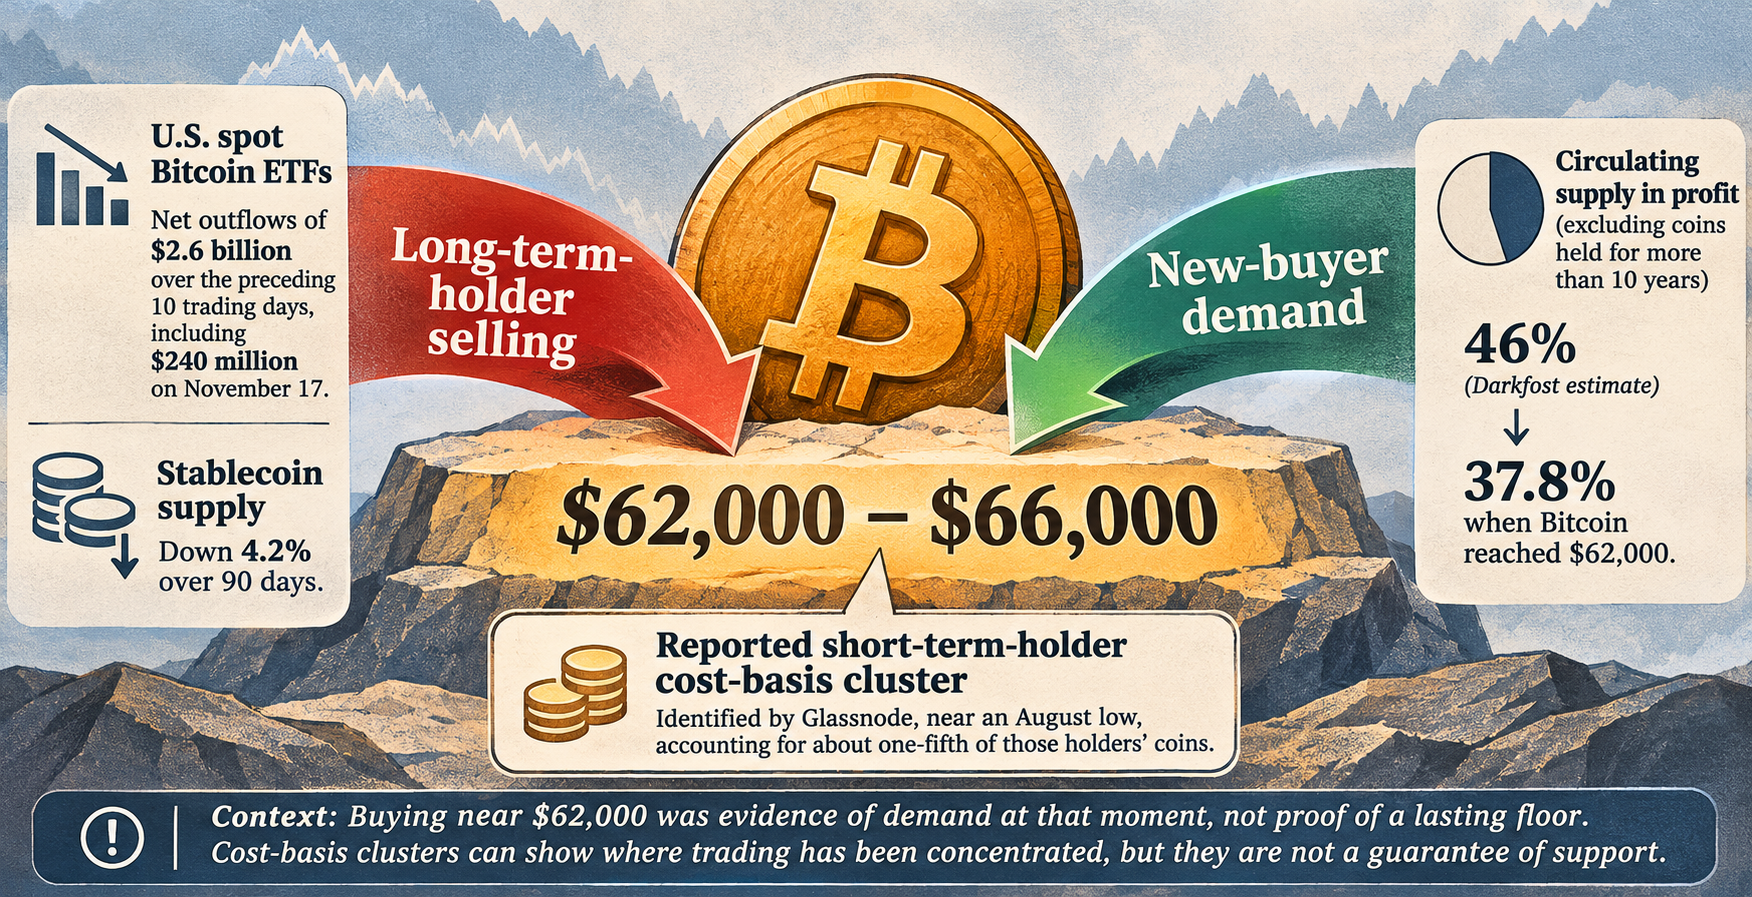
The holder figures need similar care. Darkfost estimated that, excluding coins held for more than 10 years, 46% of circulating supply was in profit, falling to 37.8% when Bitcoin reached $62,000. That is not a measure of whether 46% of individual owners were profitable. Analysts also differed on what a break lower might mean: Rekt Capital warned that a weekly close below roughly $63,300 could precede another decline, while Wintermute’s trading team said a rebound without renewed ETF inflows and a daily recovery above the 200-week moving average—then around $68,188—would look more like short covering than a trend reversal.
Cost-basis clusters can show where trading has been concentrated, but they are not a floor. The reported buying near $62,000 was evidence of demand at that moment, not proof that it would persist.