
In a report published on November 18, 2026, K33 argued that Bitcoin was showing signs often seen near a local market bottom. Its evidence pointed to heavy losses and demand for downside protection—not proof that the decline was over.
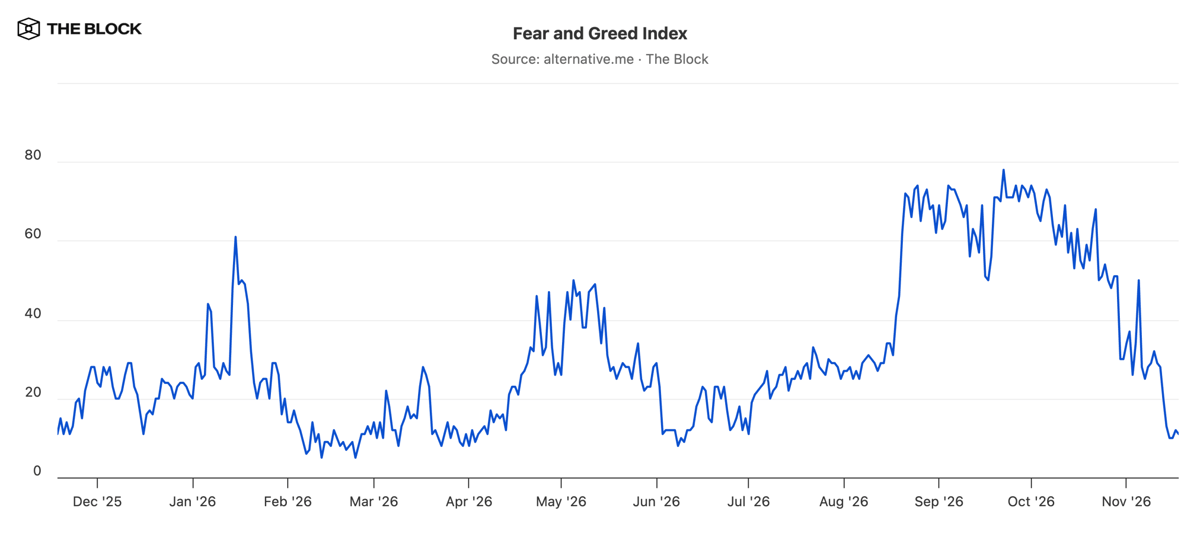
Bitcoin had fallen 14% over the preceding week after six straight weekly losses. K33 Head of Research Vetle Lunde said its daily relative strength index had reached 19.95 on the preceding Saturday and that 51.5% of circulating bitcoin was held at a loss. K33 also reported negative funding rates and leveraged ETF exposure at multi-year lows.
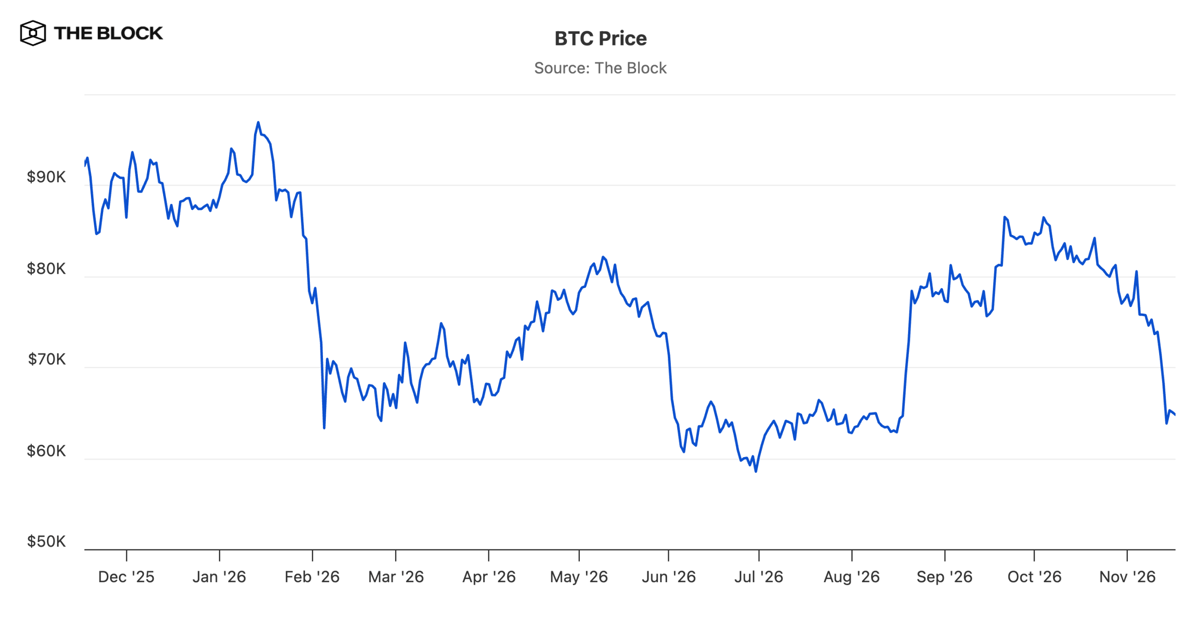
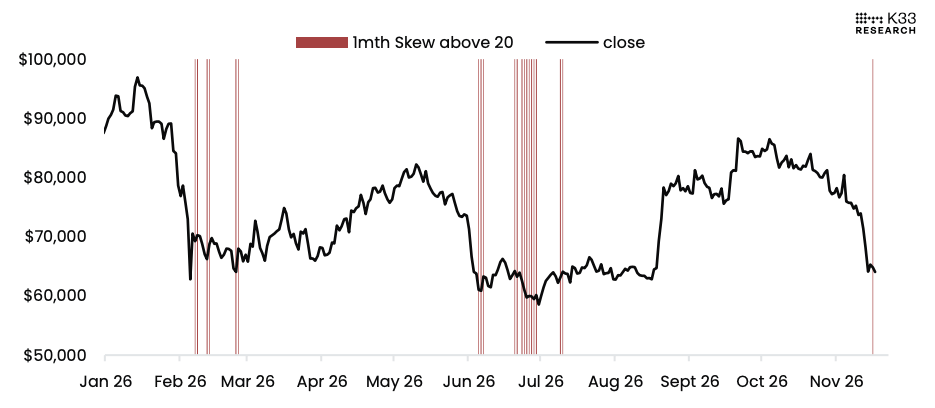
In options markets, demand for downside protection pushed the one-month 25-delta skew above 20 for the first time since July, according to K33. Lunde said comparable readings had historically appeared near local bottoms, but cautioned that earlier recoveries involved prolonged consolidation rather than an immediate rebound. Bitcoin was trading around $64,000 on November 18, the report said.
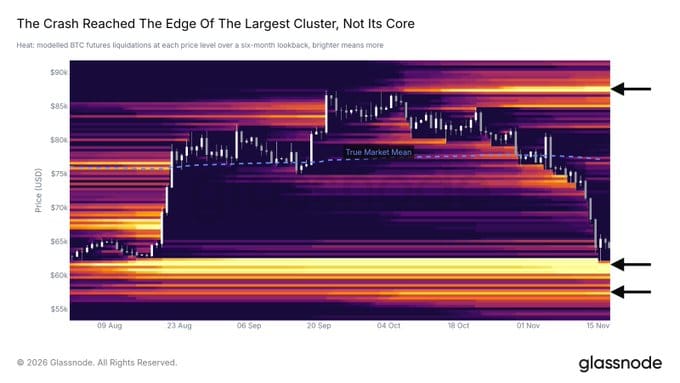
What would weaken the bottom case? Glassnode identified a daily close below $62,000 as a level to watch. It said that could put buyers from August at a loss and open a path toward June’s low near $58,500, then the realized price near $53,700. Glassnode also noted a concentration of buy orders near $60,000 on Binance, while warning that traders could withdraw those orders before they filled.
The signals describe conditions that have accompanied past lows; they cannot establish where this decline will end. The distinction matters most at the levels Glassnode identified, where a further fall would test the case for a local bottom.